Transit analytics · 2026
TTC Delay Analysis
Where, when, and why do TTC delays concentrate — and what predicts a major delay? A reproducible R + PostgreSQL pipeline over 1,251,597 reported incidents, with logistic and negative binomial models.
- reported incidents, 2014–2026
- 1,251,597
- of incidents are bus
- 64.8%
- 2024 holdout AUC
- 0.756
Architecture
Select a stage to explore it.
01 · City open data
Every yearly subway, bus, and streetcar file plus the rolling since-2025 extract, downloaded with SHA-256 checksums. Raw files stay out of git; re-running the pipeline re-fetches them.
Visuals
01 · Problem
TTC service planning has limited recovery time, vehicles, and staff. A network-wide average hides the fact that bus, streetcar, and subway delays behave differently, and that a small number of lines and locations carry a large share of the problem.
The analysis asks where, when, and why delays concentrate, and which factors are associated with a reported delay lasting 15 minutes or more.
02 · Solution
An R + PostgreSQL pipeline over 1,251,597 incidents from 2014 to 2026: ingest every City of Toronto resource, harmonise the schemas, load PostgreSQL, build the analytical views in SQL, then fit and diagnose two models in R. The pre-registered analysis plan was committed before any model was estimated.
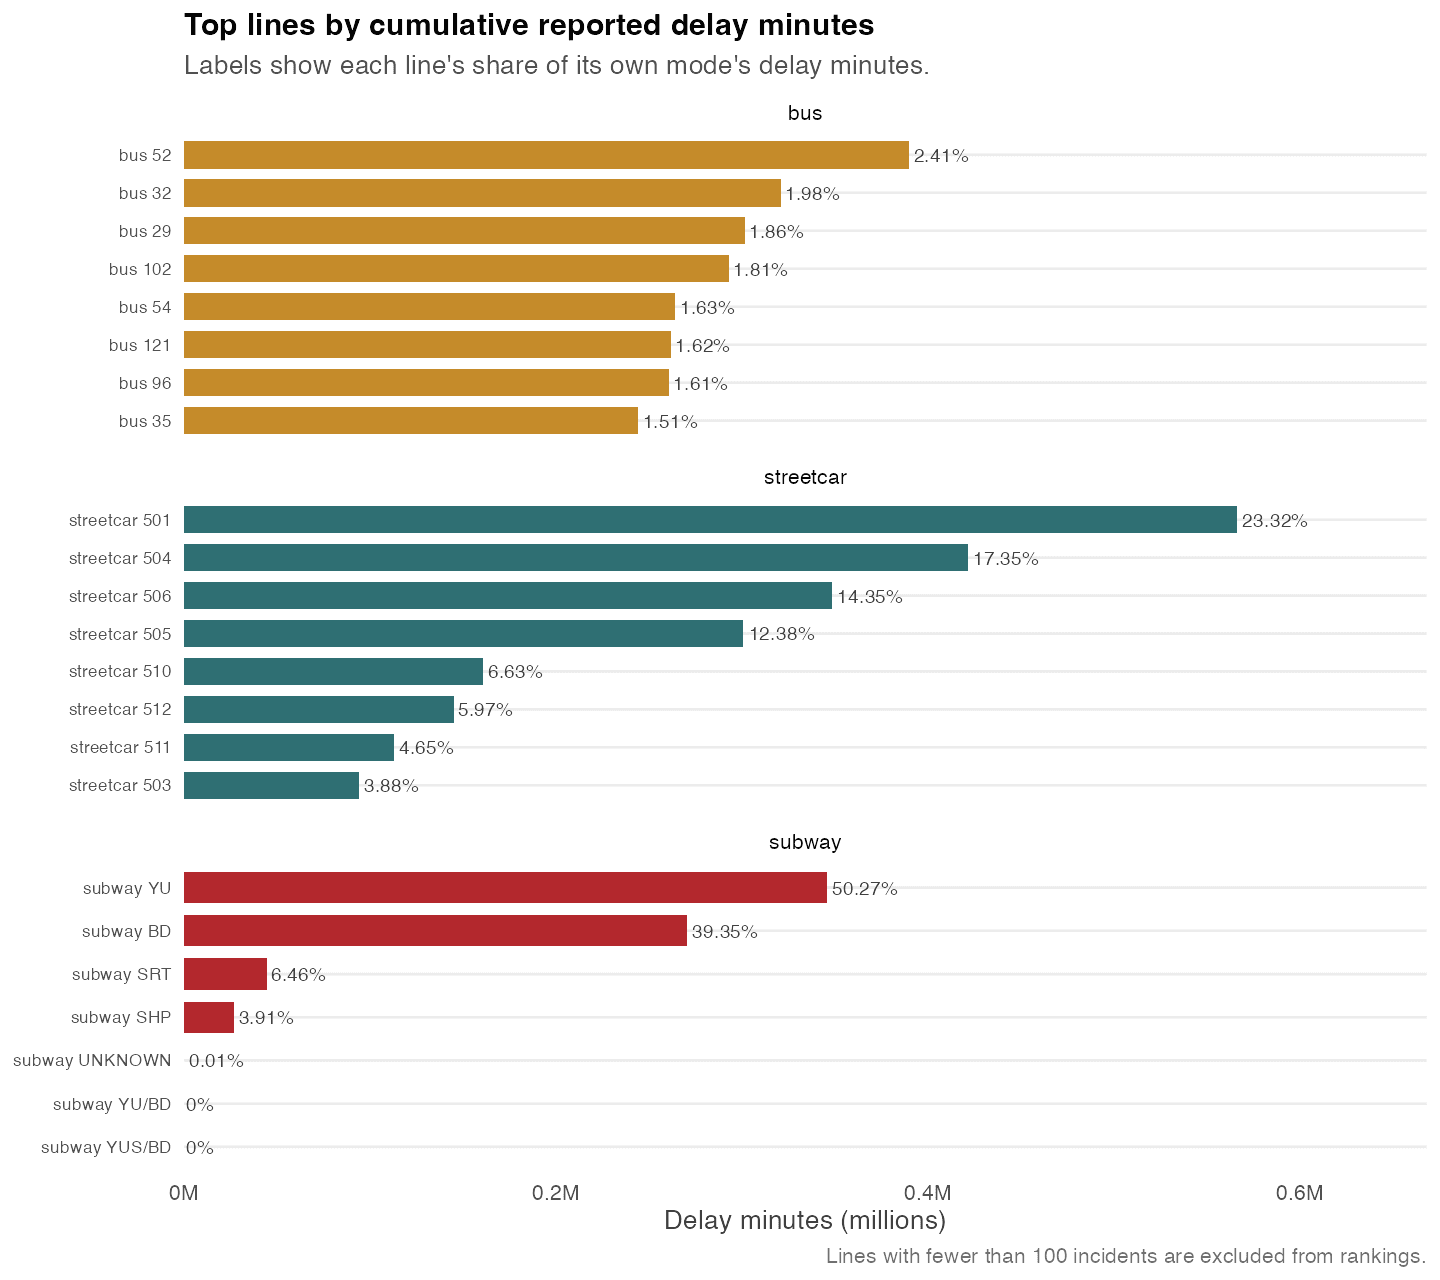
Bus is 64.8% of incidents and 83.9% of reported delay minutes. The top 5 streetcar lines are 74.0% of streetcar delay minutes, while the top 10 bus lines are only 17.4% of bus delay — the bus problem is network-wide, the streetcar problem is line-specific.
03 · Findings
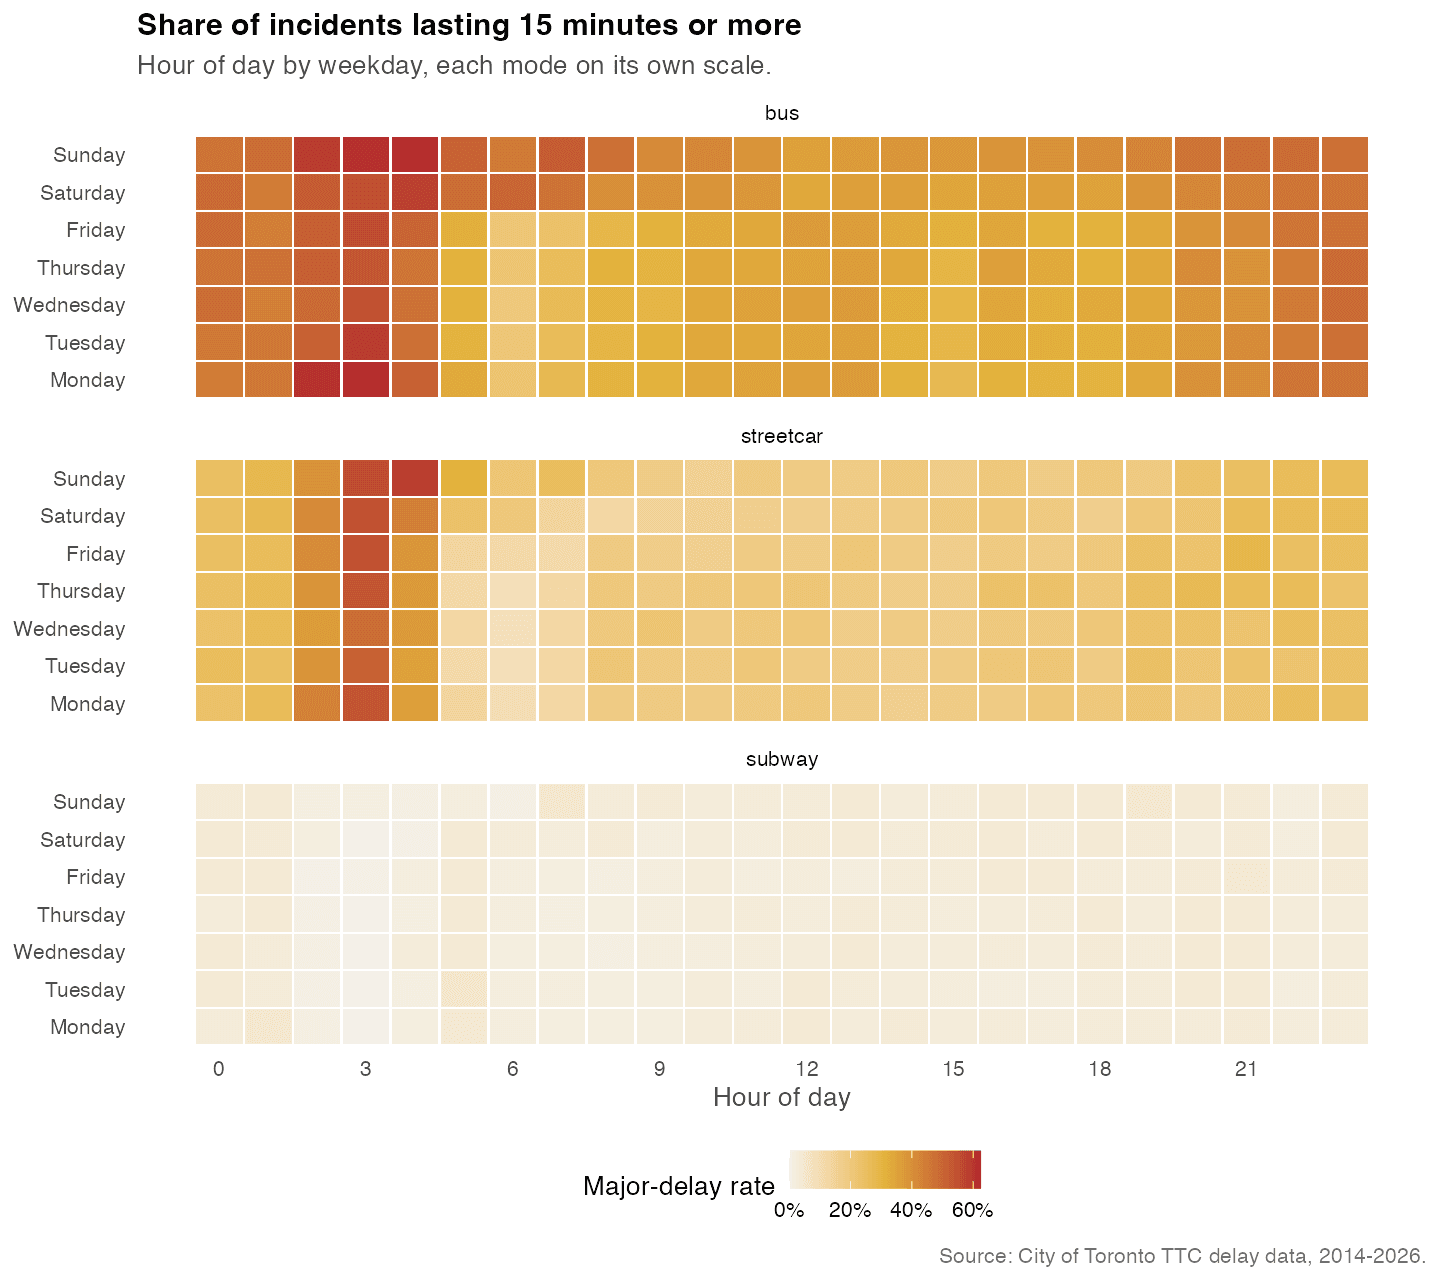
Major delays peak overnight, not in the PM rush: the 15-minute-plus rate is 57.3% at 03:00 on bus and 53.4% at 03:00 on streetcar. Hour 3 has an odds ratio of 1.71 relative to midnight; the PM peak is lower than midnight. The pre-specified PM-peak hypothesis is not supported.
The overall major-delay rate is 25.7%. Bus is highest at 34.5%, streetcar 20.5%, and subway 2.65%. The logistic model reaches AUC 0.756 (95% CI 0.753–0.759) on the 2024 holdout and under-predicts 2024 severity (mean 24.2% vs observed 28.1%). COVID has a negative binomial rate ratio of 0.79.
04 · Engineering decisions
The SQL does the heavy aggregation: line/location ranks, 28-day rolling averages, year-over-year change, and cumulative shares live in versioned views, and R reads those views instead of re-implementing the same group-bys. The universe is one grain, not one script per chart.
The measurement caveats are part of the result: 1,233 records contain a 999-minute placeholder, legacy bus/streetcar files use coarse cause labels, and the 2025 schema renames routes to lines. Those are documented in the limitations instead of quietly dropped.
05 · Limitations
Reporting bias: an incident only appears if someone reports it and a delay code is assigned. There is no ridership, weather, construction, or staffing denominator. Cause categories are coarse before 2021, the 2025 schema breaks the legacy route coding, and the final month of the rolling extract may be partial.
The 2024 holdout is one year and is harder than the training period. VIF is high for the line-group specification because line groups nest inside modes. Every model result is an association, not a causal effect.