Data science research · 2026
Behind the Feed
Does personalized news exposure cost people diversity? A reproducible analysis of 8.6 million Microsoft News impressions for the TECHNATION Behind the Feed challenge, with Margil Parekh.
- logged impressions analyzed (MIND)
- 8.6M
- entertainment's exposure vs. catalogue share
- 5.08×
- categories for −3.2% nDCG@10 (simulated MMR)
- +89%
Architecture
Select a stage to explore it.
01 · MIND dataset
Microsoft News articles and anonymized US behaviour logs. An impression is treated as a proxy for exposure and a click as engagement — never as proof that something was read.
Visuals
01 · Question
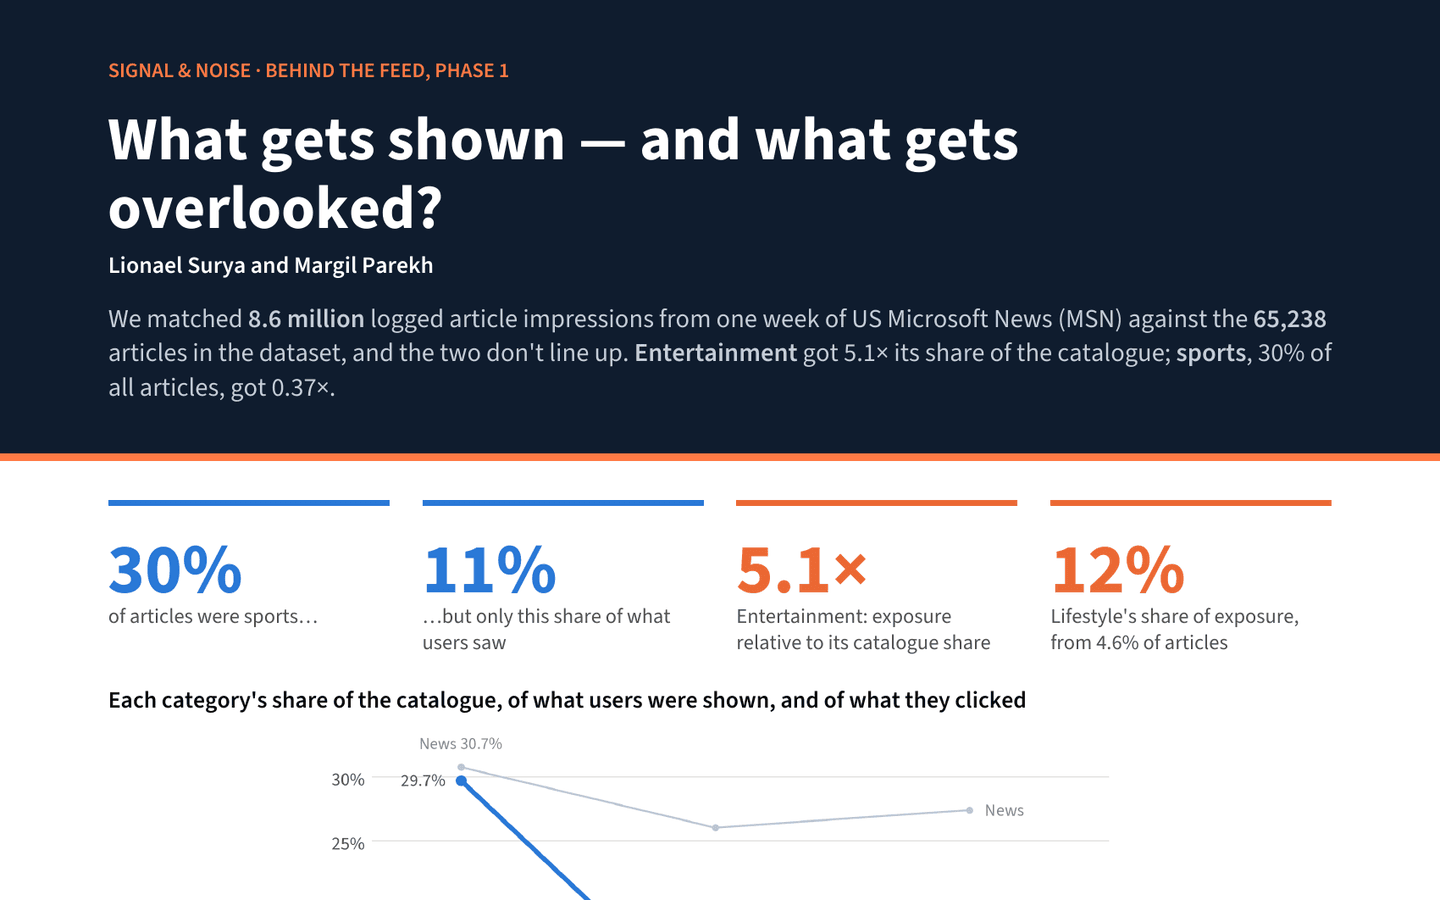
A news feed decides which stories millions of people see. If it reflects only what each person already clicks, readers could end up with a thinner slice of the news without noticing. We set out to measure whether exposure mirrors the catalogue, whether it narrows over time, and what diversity would cost a recommender.
02 · What we found
Exposure did not mirror the catalogue: entertainment received 5.08× its catalogue share while sports — 29.7% of articles — received 0.37×, and over-exposure was unrelated to click-through rate. The top 1% of shown articles took 34.7% of impressions. Exposure leaned only modestly toward users' past favourites (1.11× a history-blind baseline) and stayed broader than clicks.
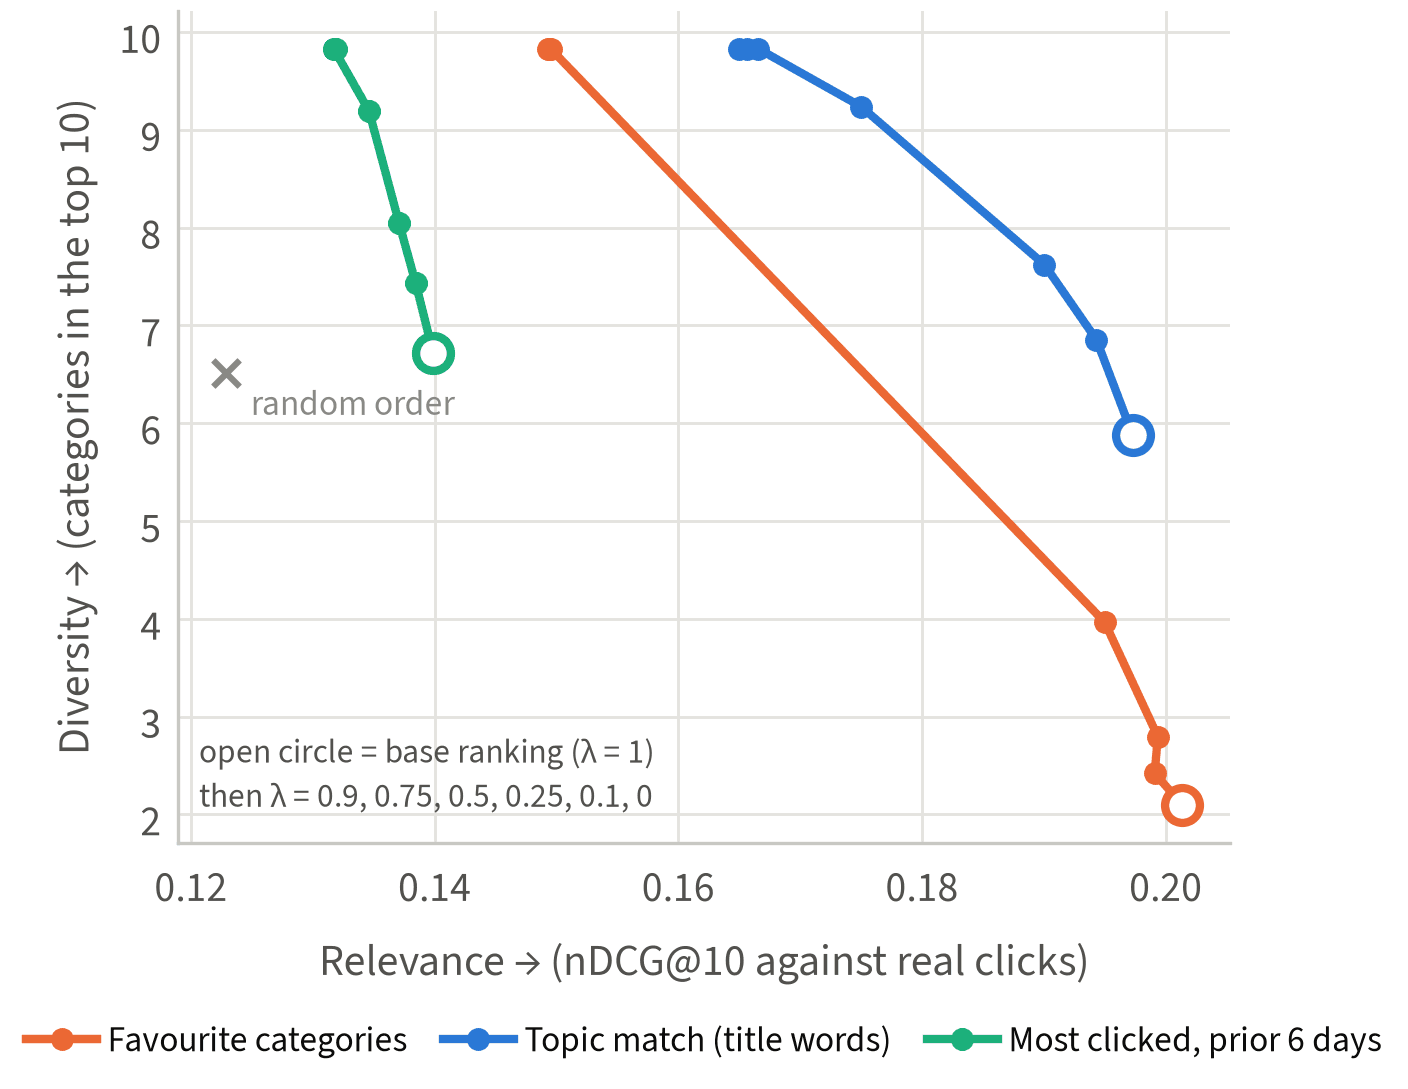
In simulation, the most accurate strategy was also the narrowest, but diversity was cheap to add: MMR re-ranking at λ = 0.5 increased categories in the top 10 by 89% for a 3.2% drop in nDCG@10.
03 · Engineering decisions
The analysis is a pipeline, not a notebook pile: four notebooks generated from scripts, a single command to rebuild every figure and the PDF, and a provenance file for every headline number. Tests run the whole chain on a synthetic fixture so results are never used to test themselves.
04 · Limitations
MIND covers one week of US Microsoft News; it does not represent Canadian audiences or the wider internet. Logs are observational, so associations are not causal, and the observed impressions were produced by MSN's own recommendation system. No demographic attributes exist and none are inferred.