Applied statistics · 2026
Beyond GDP
Does GDP per capita actually predict national happiness once health, employment, connectivity, urbanization, and inflation are controlled for? A reproducible R regression pipeline that tests the association, its nonlinearity, and its stability.
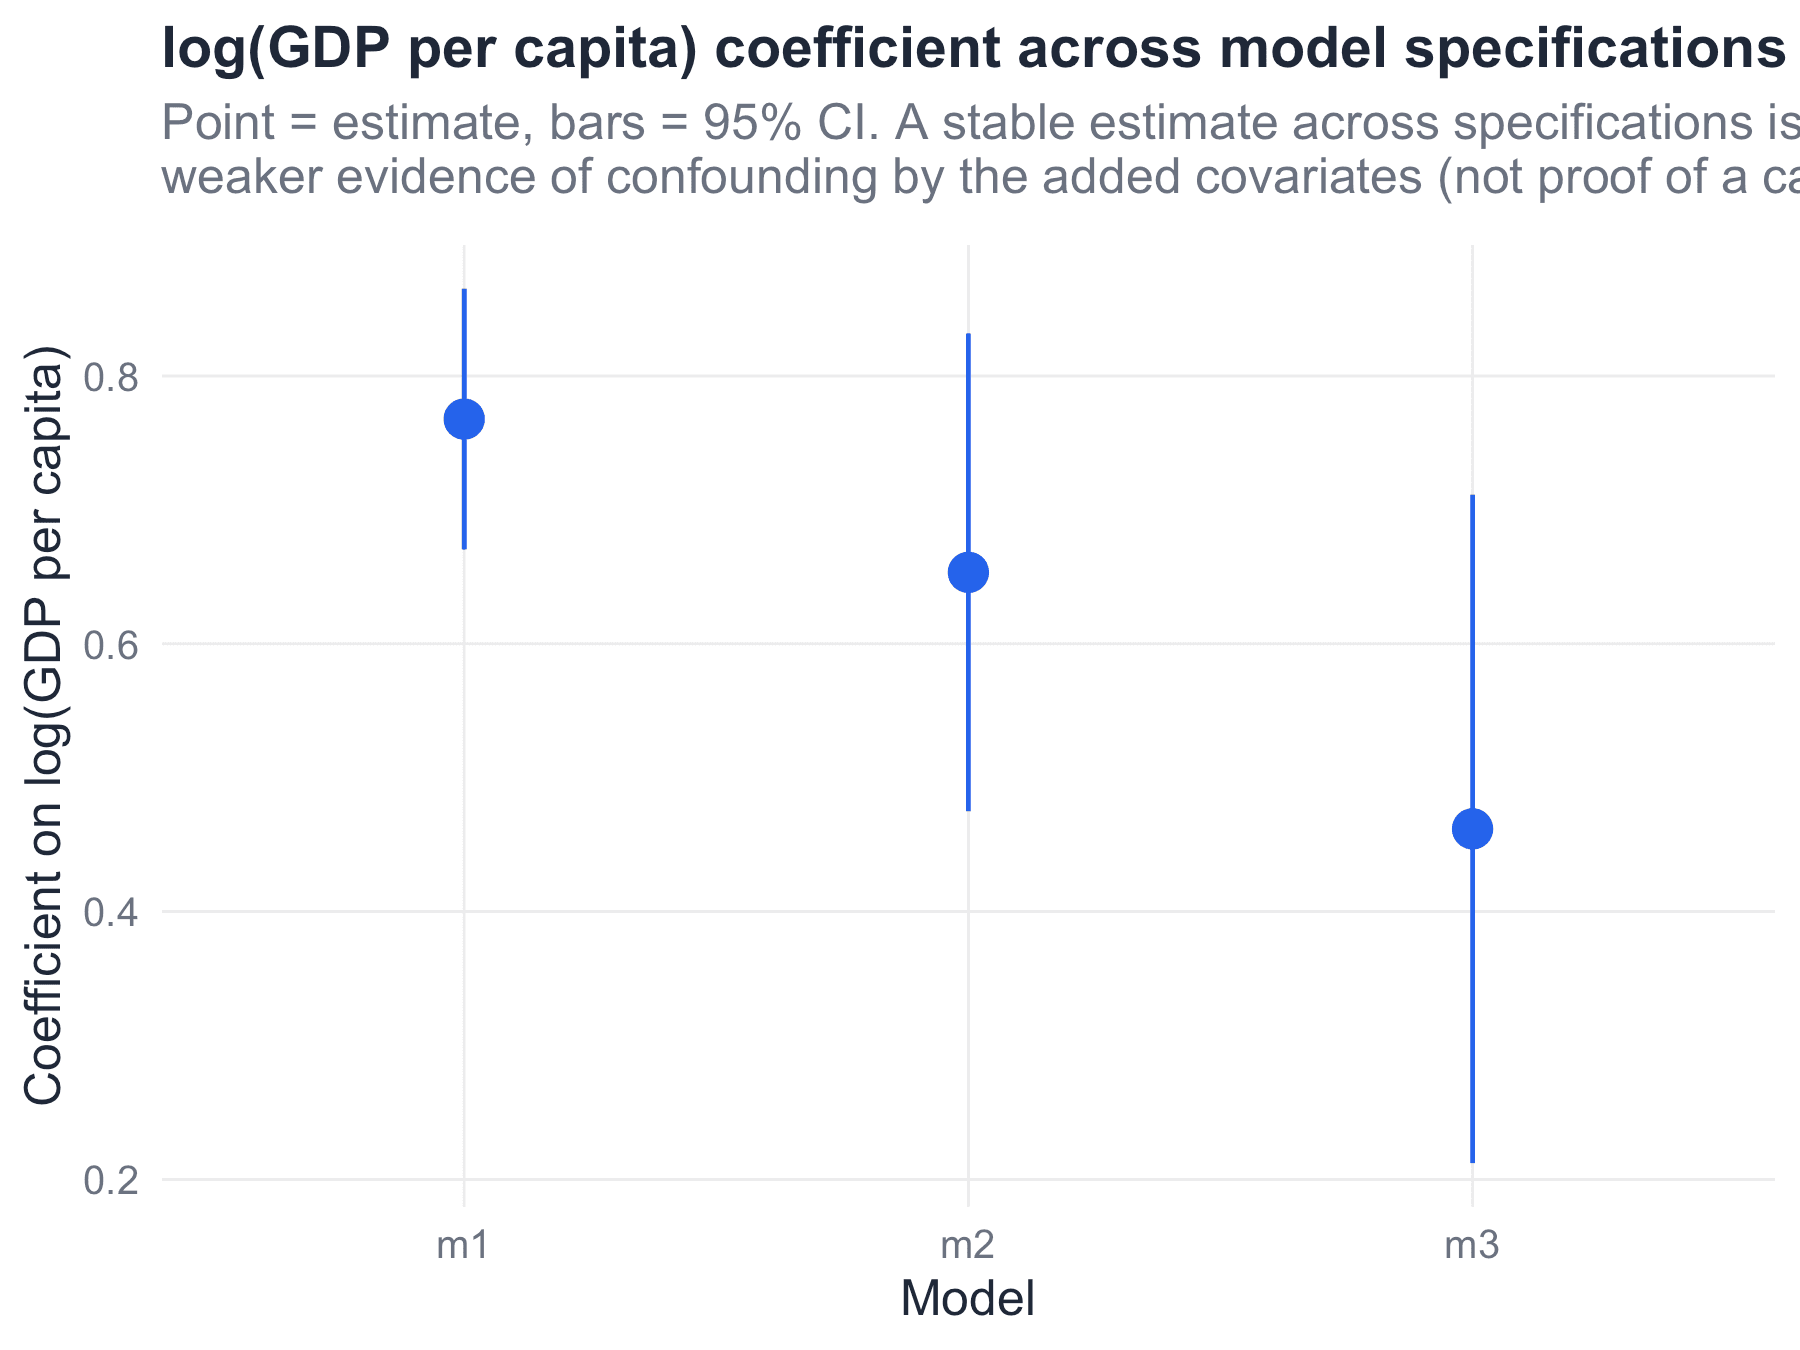
- GDP coefficient (95% CI 0.21–0.71)
- 0.462
- countries in the primary sample
- 144
- coefficient range across sensitivity checks
- 0.409–0.497
Architecture
Select a stage to explore it.
01 · Official sources
Life Ladder comes from the World Happiness Report; every predictor is pulled independently from the World Bank REST API. The report's own decomposition columns were rejected as predictors after verifying they sum to the outcome by construction — max discrepancy 0.003 across 1,013 fully decomposed rows.
Visuals
01 · Problem
Most public treatments of the happiness–income question reuse the World Happiness Report's own "Explained by: GDP" columns as if they were independent predictors. A Phase 0 feasibility check showed those columns are the report's regression output and sum to the Life Ladder score by construction, which would make the analysis close to circular.
The real question is narrower: after sourcing predictors independently, does GDP per capita remain associated with life satisfaction once health, employment, connectivity, urbanization, and inflation are in the model?
02 · Solution
A reproducible R pipeline that pulls official data from the World Happiness Report and the World Bank API, documents the country-code join, and fits a progressive series of OLS models. It then runs a full diagnostic suite, tests nonlinearity and one interaction, and reports five pre-specified robustness checks plus a pooled-panel re-estimation.
Every coefficient is reported with a 95% CI and described as an association. The pipeline produces 19 ggplot2 figures and 19 tests from the same scripts.
03 · Findings
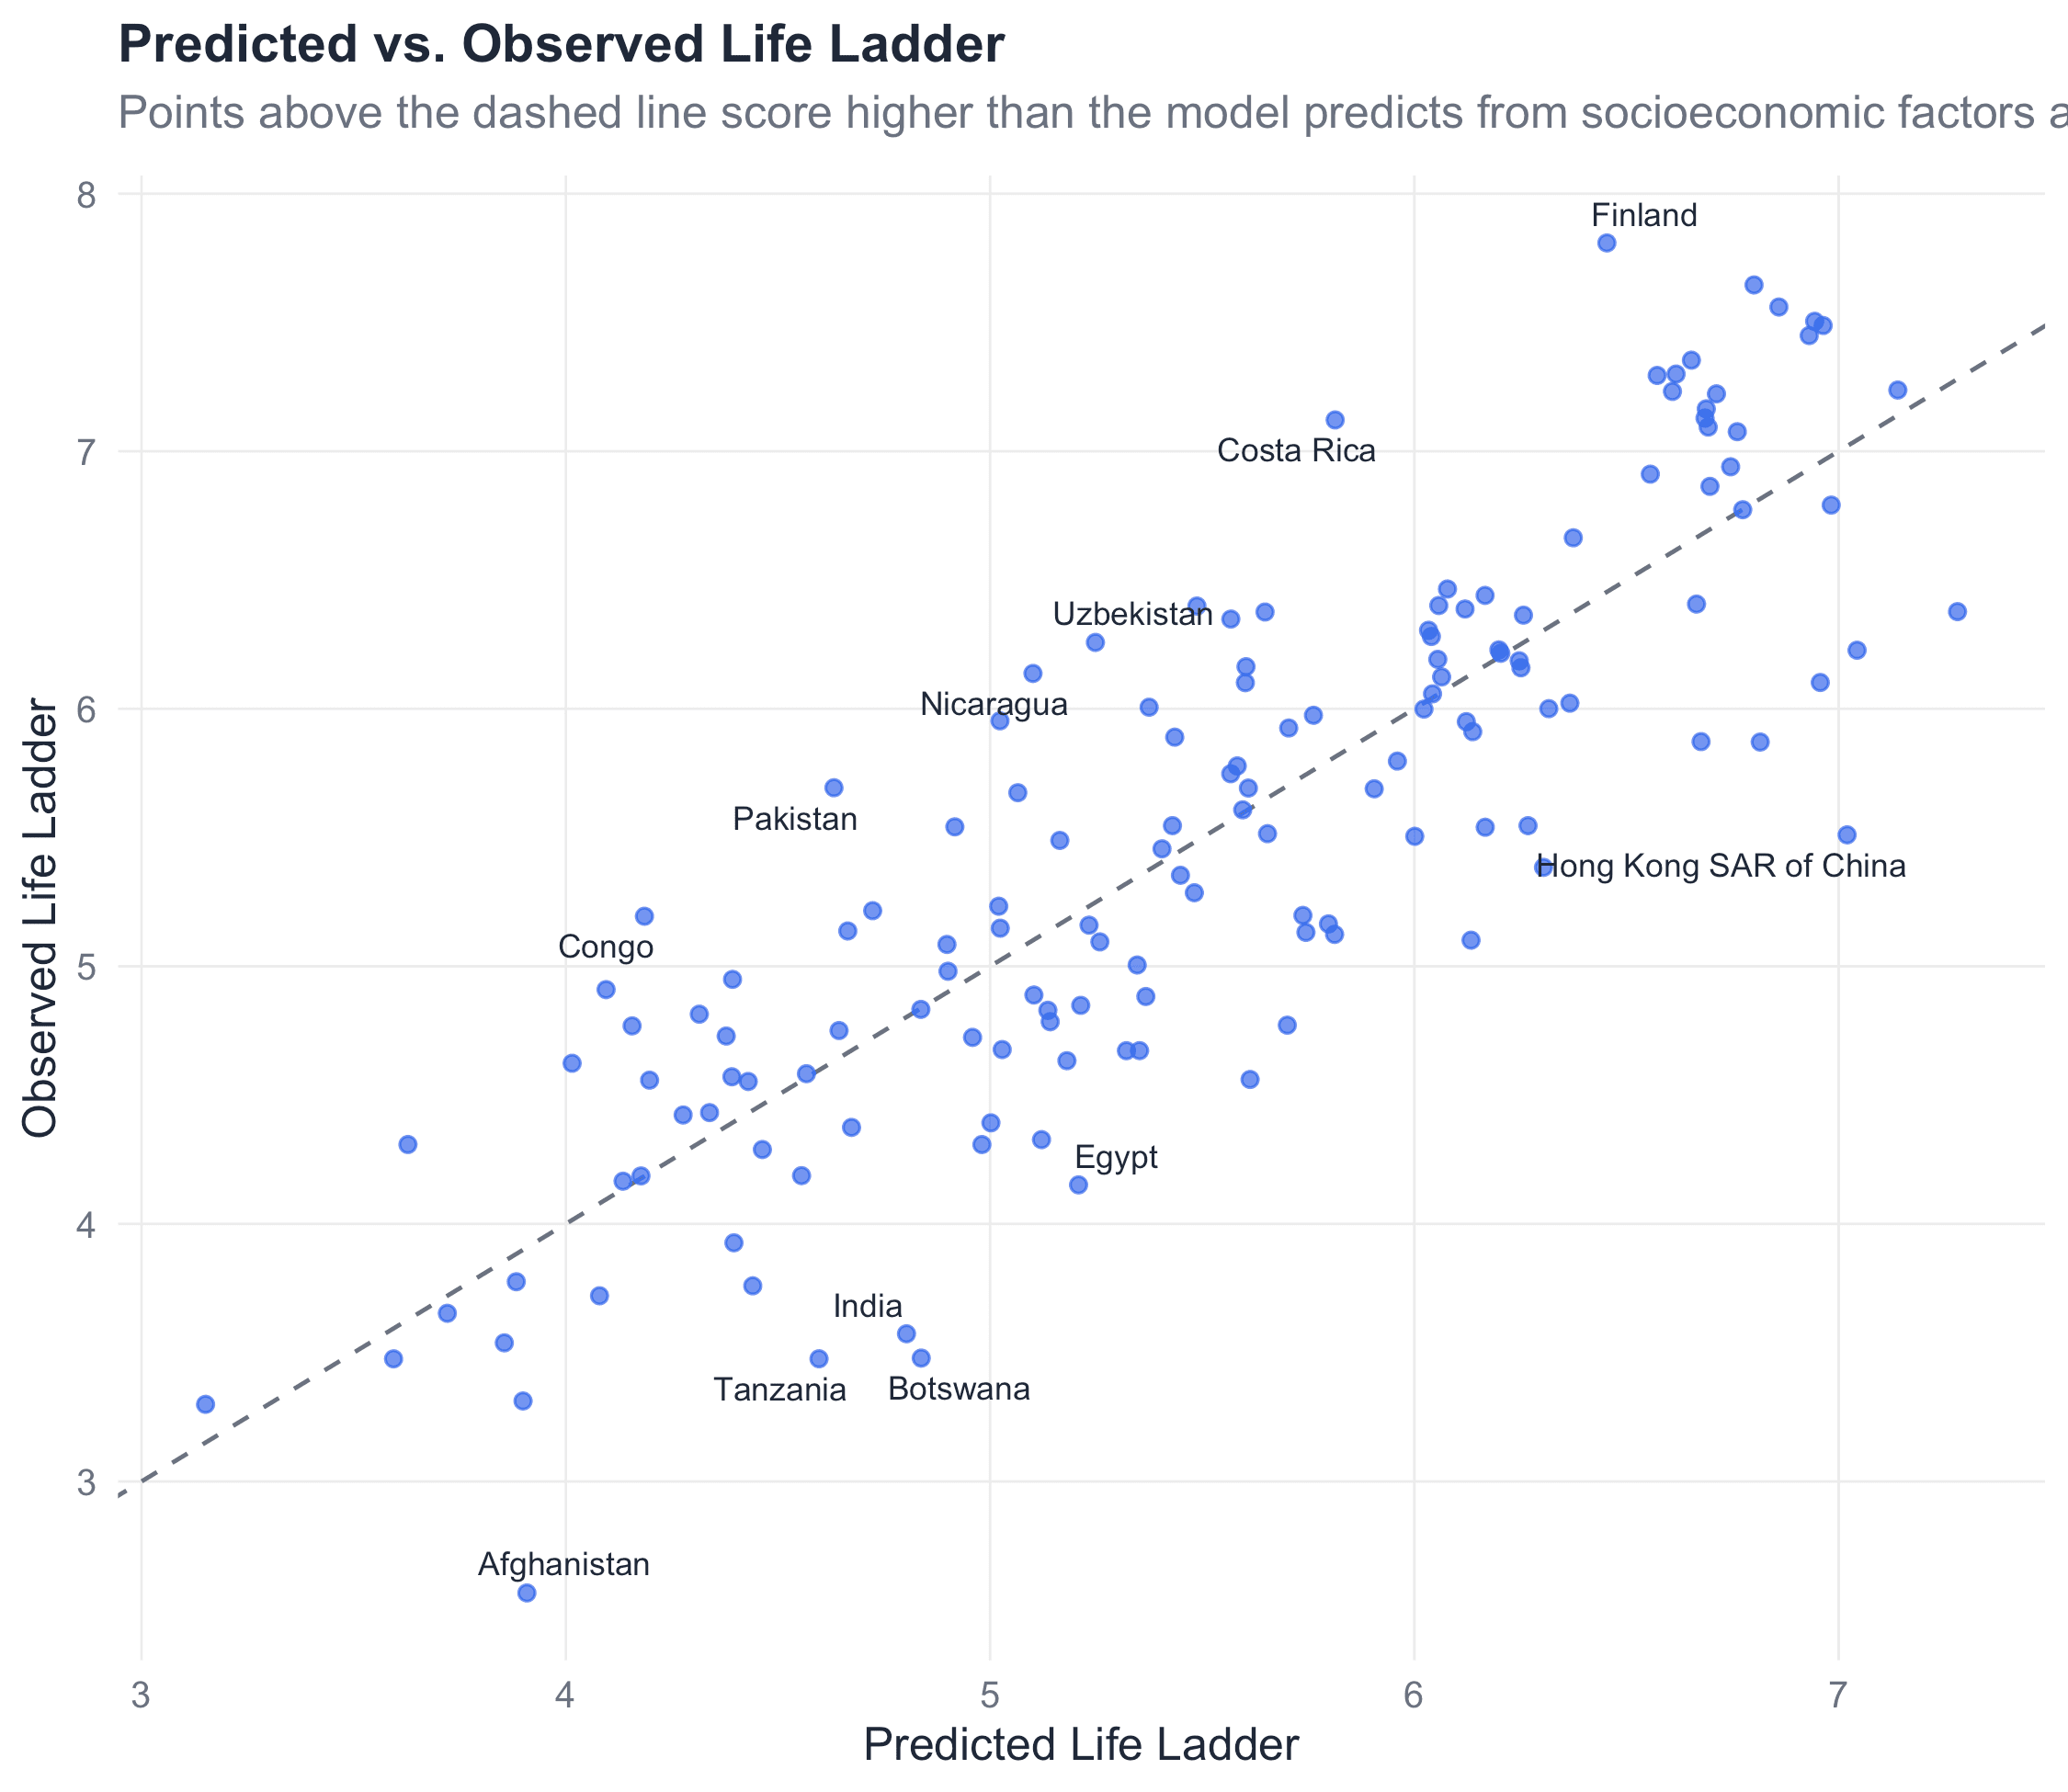
GDP per capita is positively associated with Life Ladder and survives the five controls: coefficient 0.462 [95% CI 0.212, 0.711], p < 0.001, N = 144 countries in 2019. Unemployment, urbanization, and inflation are also independently associated; life expectancy and internet use are not once GDP is in the model.
There is no evidence of a diminishing-returns quadratic (p = 0.222) or a GDP × unemployment interaction (p = 0.259). The GDP coefficient stayed within 0.409–0.497 across sensitivity checks and the pooled panel.
04 · Engineering decisions
Data feasibility came before code: OECD well-being data covered only ~38–41 countries against 144–168 for WHR/World Bank, so it was ruled out. The report's decomposition columns were rejected as predictors after the arithmetic check. The primary year was chosen for maximum complete-case coverage, not recency, and that choice is documented.
The result is a pipeline, not a notebook: numbered scripts, a single run_all entry point, renv.lock, and tests that check the chain rather than the headline coefficients.
05 · Limitations
The data are observational, cross-sectional, and country-level. Social support, trust, and inequality are omitted because no adequate free, independent source was found. GDP and internet use are collinear enough (VIF ≈ 8.5–8.7) that internet use's independent association cannot be cleanly separated. Life Ladder is a three-year rolling average matched to single-year World Bank predictors.
Thirteen limitations are documented in the case study; none are softened into a causal claim.