Spatial analytics · 2026
Toronto Mobility Intelligence
A reproducible PostgreSQL + PostGIS platform that turns 20 years of Toronto's official collision data into findings a city team could defend — from Open Data to a Power BI dashboard.
- passing tests
- 91
- spatial match radius, derived from data
- 20 m
- curated analytical SQL queries
- 19
Architecture
Select a stage to explore it.
01 · Toronto Open Data
KSI collisions, traffic volumes, traffic signals, and neighbourhood boundaries, downloaded through the CKAN API with schema-drift detection before anything is loaded.
Visuals
01 · Problem
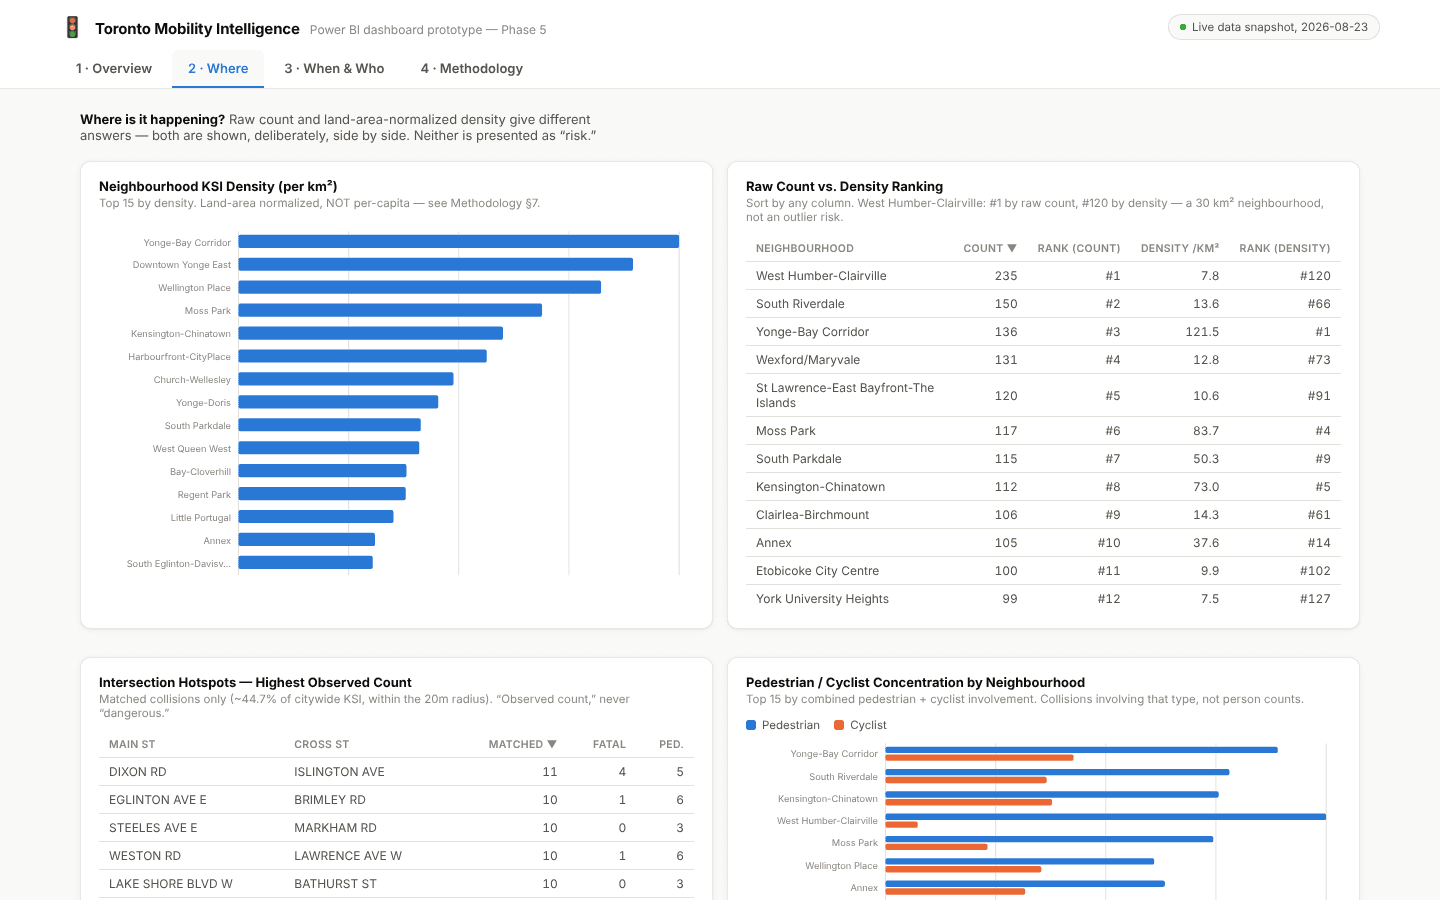
Collision counts show where severe crashes happened, but not where risk is concentrated: a large, busy neighbourhood accumulates more collisions almost by construction. The goal was a platform that answers what, where, when, and who honestly — normalizing where a fair denominator exists and saying so where it doesn't.
02 · Findings
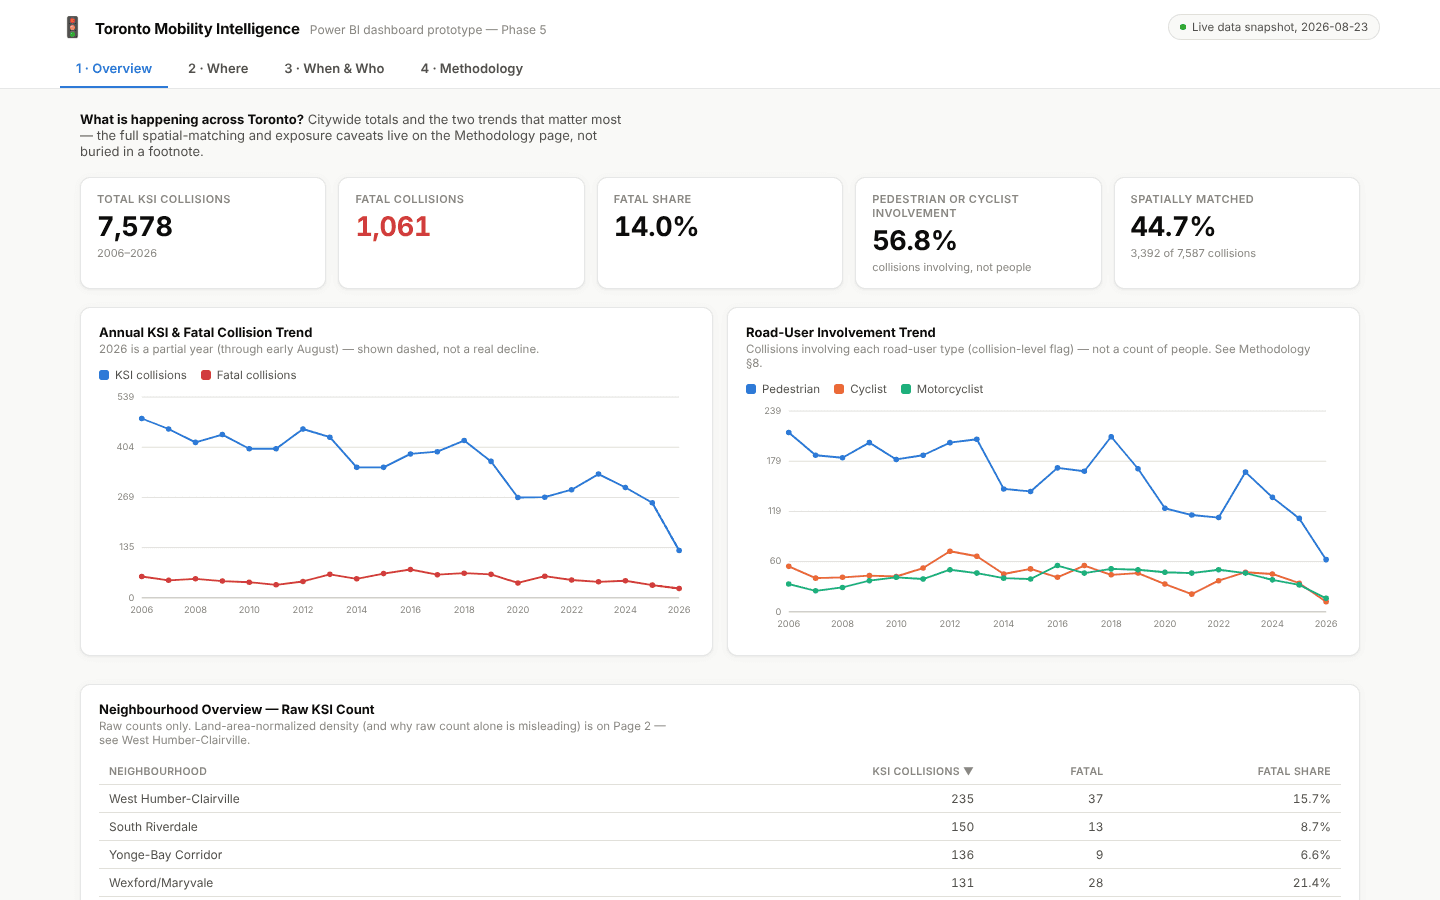
The fatal share of KSI collisions rose from under 12% (2006–2012) into a 13–22% range from 2013 onward, even as raw counts fell. Pedestrians and cyclists were involved in the majority of KSI collisions in every year. West Humber-Clairville ranks first by raw count but 120th of 158 once normalized by land area.
03 · Engineering decisions
No layer skips the one below it: the dashboard never touches raw data, and no business logic is defined in DAX that isn't already in SQL. The spatial match radius was derived from the observed distance distribution and cross-validated against the source data's own location fields, and the 44.7% match rate is reported as expected rather than hidden — most severe collisions happen midblock.
04 · Limitations
KSI captures only collisions where someone was killed or seriously injured. Traffic counts are not temporally aligned with collision history, so the exposure metric compares intersections cross-sectionally, never as a trend.