Policy analytics · 2026
Nutrition Priority Index
A transparent, evidence-backed index ranking Indonesia's 38 provinces for child-nutrition intervention — built on real government data only, validated before published.
- passing tests
- 67
- outcome correlation (Spearman)
- 0.74
- provinces covered
- 38/38
Architecture
Select a stage to explore it.
01 · Government sources
Seven datasets from Statistics Indonesia's WebAPI, health-ministry exports, and official province boundaries. Every file is traceable to a real government source — zero synthetic values anywhere in the pipeline.
Visuals
01 · Problem
Indonesia funds child-nutrition interventions — like the national Makan Bergizi Gratis school-feeding program — across 38 provinces with very different needs and a limited budget. Which provinces come first, and on what basis?
A ranking a policymaker can't audit is a ranking they can't defend. That constraint shaped the whole system: every dataset traceable, every methodological choice tested against an alternative, every limitation documented in plain language.
02 · Solution
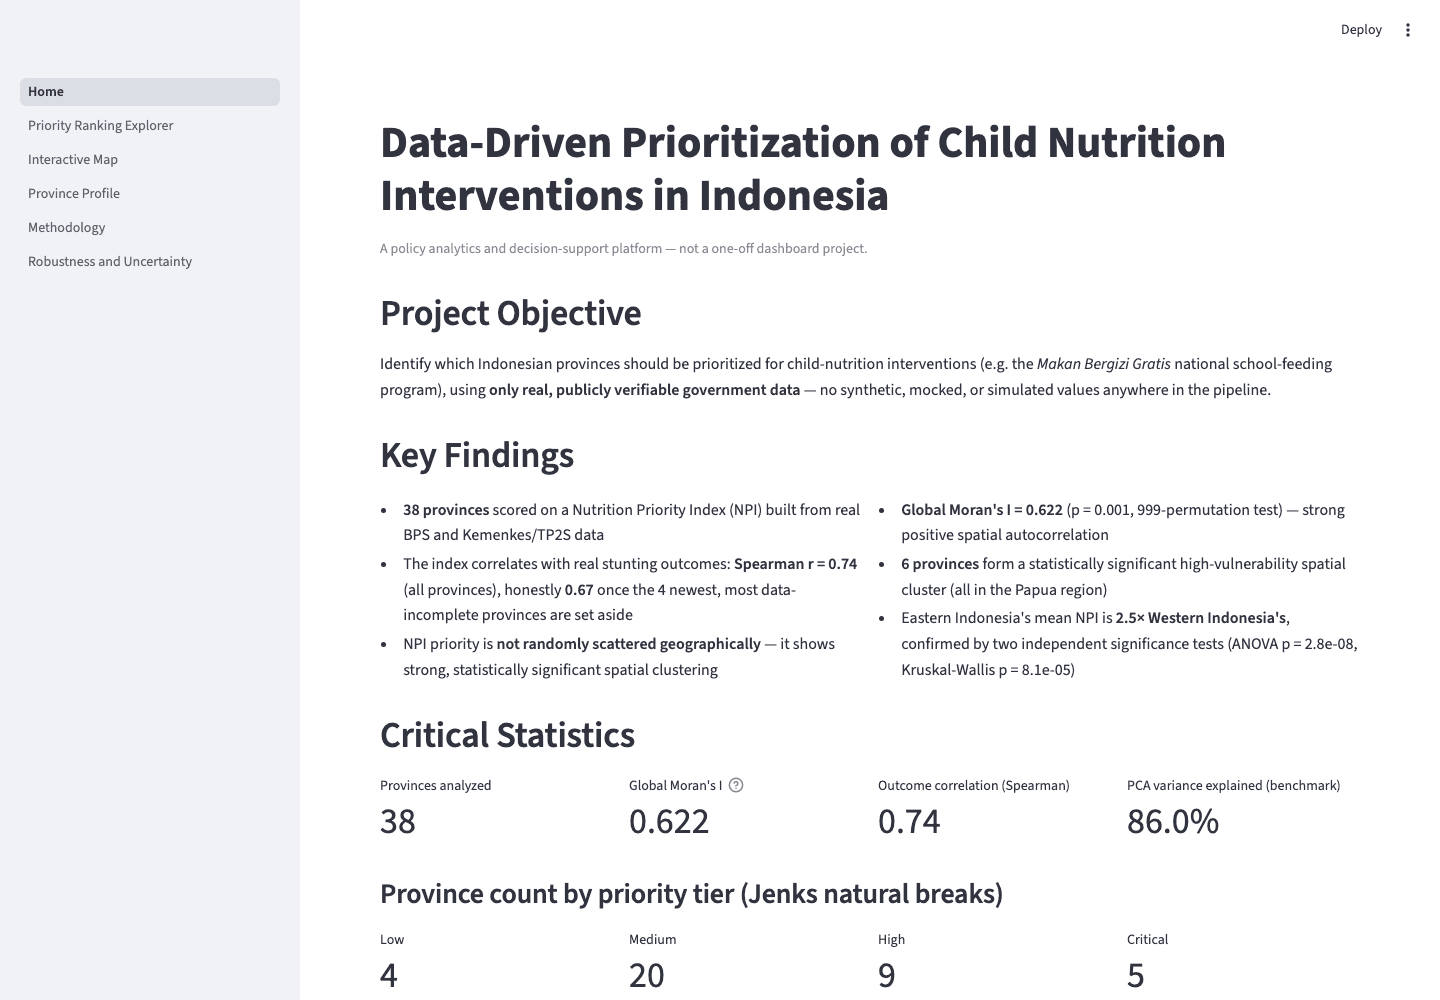
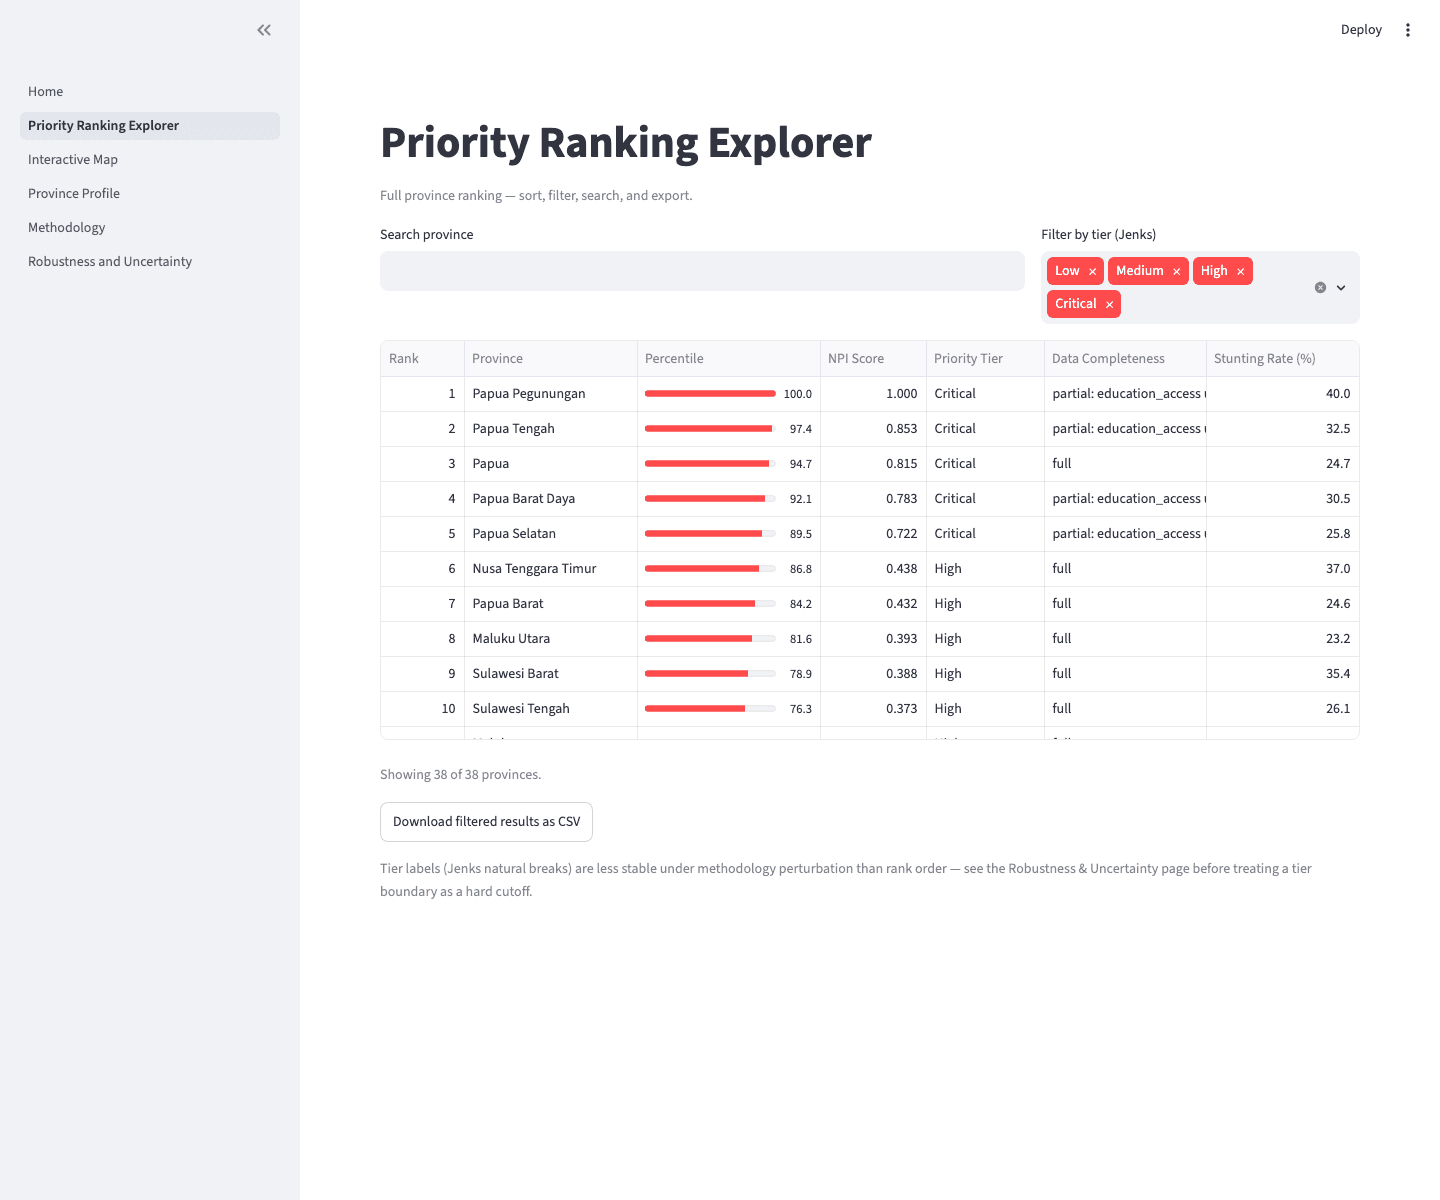
A Nutrition Priority Index built exclusively from real government data, combining socioeconomic vulnerability with education access. The ranking was validated before it was published: against real outcomes (Spearman r = 0.74), against weighting perturbation (rank order stable at r > 0.99 across ±20%), and against an alternative methodology.
03 · Engineering decisions
The defining decision: the sophisticated method lost. A PCA composite of three collinear indicators had the textbook rationale, but a single expenditure-per-capita signal predicted outcomes slightly better (r = 0.74 vs 0.72), needs no fitted parameters, and explains itself in one sentence. It won a scored decision matrix 23–13 and was promoted; PCA is retained as a documented sensitivity benchmark, not deleted.
Stunting prevalence is reported as outcome context but never used as a weighted input — that would validate the index against the thing it was built from.
04 · Challenges & trade-offs
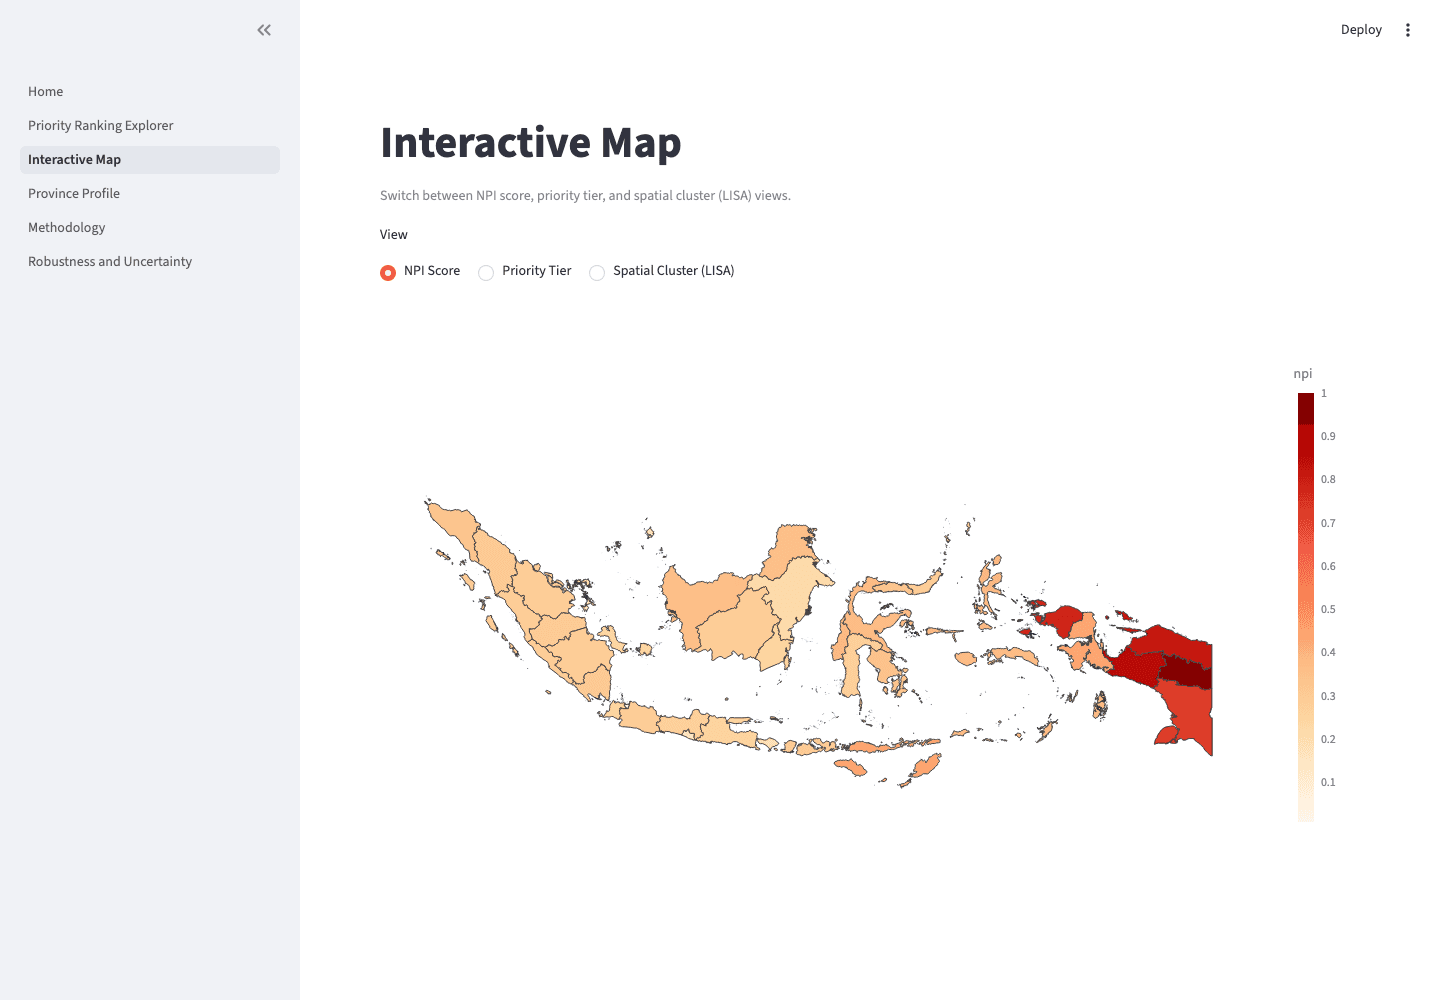
No scriptable source exists for stunting data; six alternatives were investigated before settling on a documented manual export. The standard boundary dataset was missing four current provinces, and the commonly-suggested workaround — duplicating parent polygons — was rejected after testing showed it would distort the spatial statistics specifically. A distinct-geometry source was found and substituted.
Honesty over headline numbers: the outcome correlation is 0.74 across all 38 provinces, but 0.67 with partial-coverage provinces excluded — both are reported. Hosting on Streamlit's free tier trades a ~30-second cold start for zero cost.
05 · Results
A live, public decision-support dashboard backed by 67 passing tests. The analysis surfaced a 2.5× disparity in mean priority between Eastern and Western Indonesia (ANOVA p = 2.8×10⁻⁸) and a contiguous high-need cluster across Papua — findings a funding allocation could act on.
06 · Lessons learned
Evidence beats elegance: the more sophisticated method isn't the better method until it wins on data. And documentation isn't overhead — it's what makes an analysis auditable, which is what makes it usable.